Purpose of the Study
The Llap River has long been subjected to a complex mixture of pollutants originating from multiple sources, including urban runoff, agricultural activities, and partial industrial discharge. Based on this knowledge, the main objective of this research is to assess, in controlled laboratory conditions (in vitro), the potential cytotoxic and genotoxic effects of water from the Llap River on the root tip cells of Allium cepa L., commonly known as the onion.
To achieve this, the study focuses on analyzing both cytotoxicity and genotoxicity parameters using Allium cepa L. as a model organism. This species has been widely recognized as a reliable biological indicator in environmental monitoring due to the high mitotic index found in its root tip cells and its ability to be easily cultivated in laboratory environments.
By examining the water’s effect on root cell division and DNA integrity, this research aims to shed light on the scale and nature of pollution present in the Llap River. In addition, it highlights the potential pathways through which such environmental contaminants may enter the food chain—ultimately affecting other living organisms, including humans.
Research Objective
Sample Collection
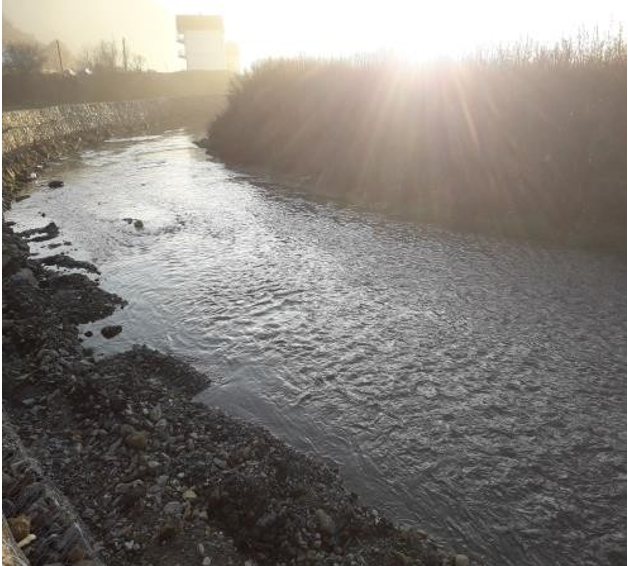
Water samples were collected at three points along the Llap River: L1 (Pollat), L2 (Podujevë), and L3 (Lupq). The water was transported to the laboratory and stored in a refrigerator at 4°C until it was used for the experiment.
Cultivation of Onions
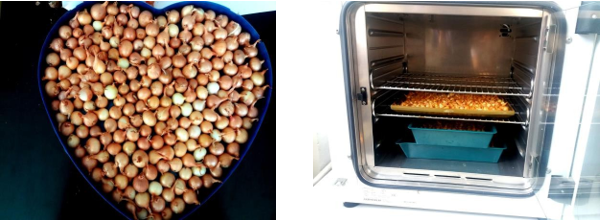
The material (onion sets) for the laboratory work was obtained from agricultural supply stores in Kosovo. All necessary tools for experimental work were provided (thermostat, Petri dishes, flasks, tweezers, etc.). The onions were planted in containers with distilled water and placed in the thermostat for 24 hours at a temperature of 25°C.
Treatment of the Onions
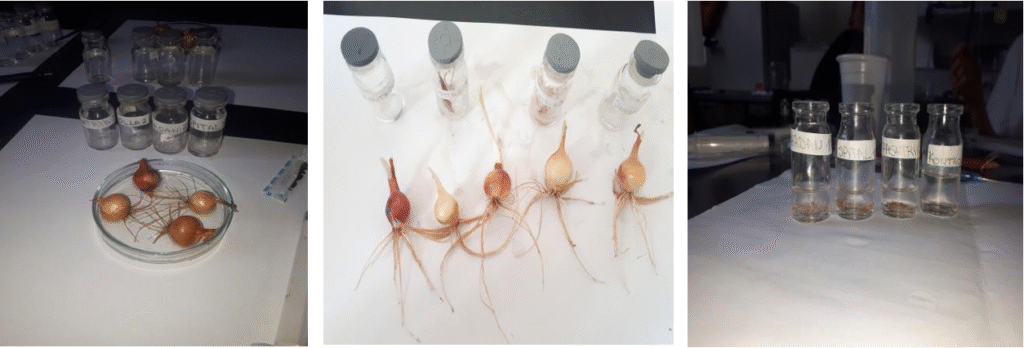
After 24 hours of cultivation in a thermostat at 25°C, the germination rate was checked. The onions (sets) with the best germination were selected, placed in Petri dishes, and treated (for 1, 3, and 6 days) with 100% concentrations of water, as well as a distilled water control.
Fixation, Maceration, Staining, and Preservation of Allium Cepa L. Root Tips
Before starting the experimental procedure, the following solutions were prepared: preservative, fixative, 1N HCl, and 45% glacial acetic acid. After 1, 3, and 6 days of exposure to specific concentrations of water, the onions were removed from the thermostat. Their root tips were cut to a length of up to 1 cm and placed in flasks.
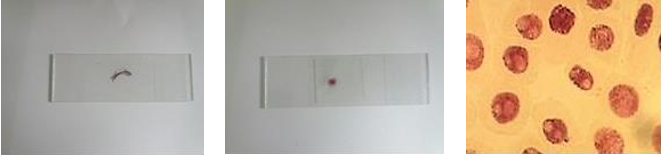
The roots placed in the flasks were treated with cold fixative for 10 minutes. After fixation, the tips of the roots were rinsed with cold water for 1 minute and drained for 2 minutes. After draining, they were treated with 1N HCl and kept in a water bath for 8 minutes at 60°C. After treatment with HCl, the tips of the roots were rinsed with cold water for 10 minutes, and the flasks were filled with aceto-orcein (dye) for two hours.
After two hours, the dye was removed, and the flasks were filled with a preservative and stored at 4°C. These roots were then ready for microscopic analysis. The same procedure was repeated after 3 and 6 days of the onion sets’ stay in the thermostat (from the planting of the onion sets).
Microscopic and Statistical Analysis
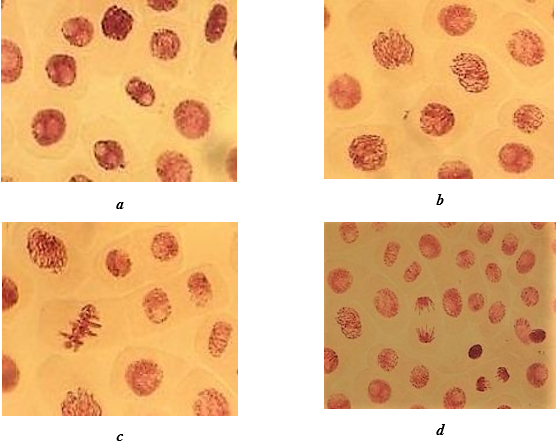
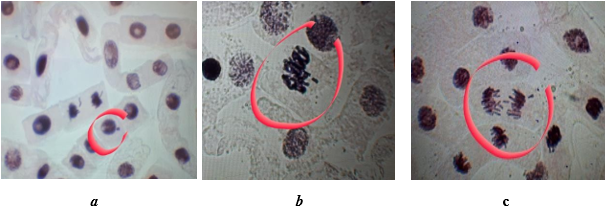
The experiment was conducted on the 1st, 3rd, and 6th days to determine the frequency of chromosomal aberrations (anaphase-telophase), the frequency of micronuclei, and the mitotic index. In each experiment, at least 5,000 cells were analyzed from 5 preparations made from the root tips of Allium cepa L.
The methodology used in these experiments followed Rank (2003), with some modifications.
The data obtained were analyzed using the SPSS software program. The mean values from the three independent experiments, the standard deviation, and the statistical significance were presented.
Disclaimer: This article is for informational and educational purposes only.